New Features: Site metrics, streamlined SES management
Idealstack • May 26, 2019
configurationIn may we released a few new features to make it even easier to manage sites in idealstack
Site Metrics and Diagnostics
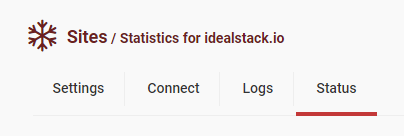
When editing a site in idealstack, check out the new 'Status' tab
This page gives you a number of useful features. Firstly the diagnostic section, which lets you quickly check your site is healthy
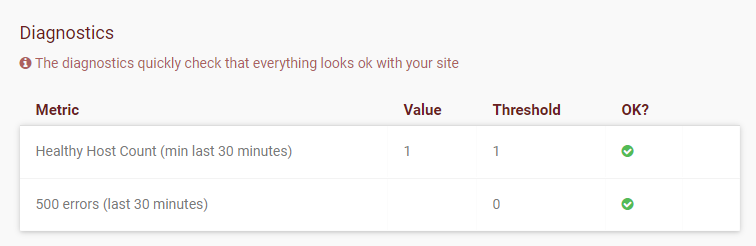
This checks that there are healthy hosts for your site (ie that the servers it is running on are return OK on the healthcheck) and that there are no 500 errors being returned by the site (eg, due to code problems)
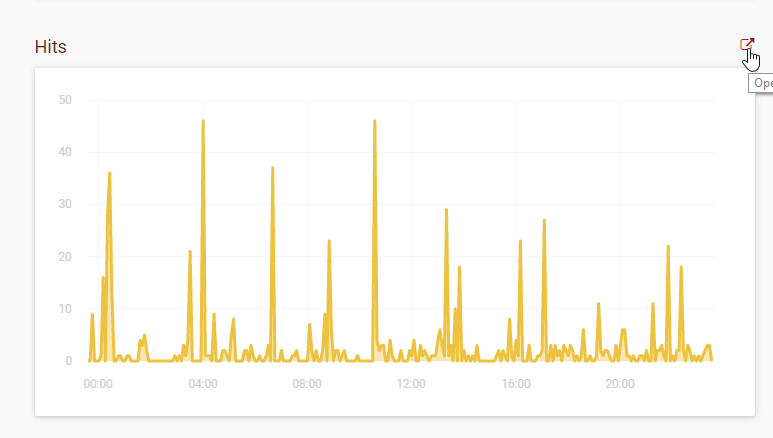
This page also shows a number of graphs of site statistics. For each of these, there's a link to AWS cloudwatch where you can do more filtering, view other date ranges and so on for this data
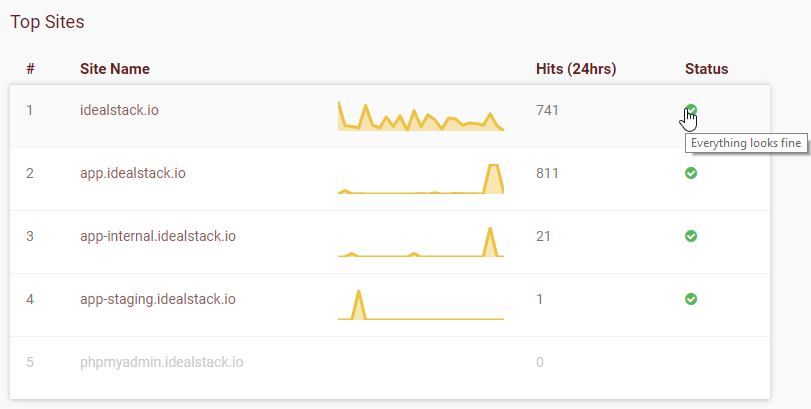
A brief summary of the hits appears as a sparkline on the dashboard and the diagnostic status is also shown there:
Improvements to SES management
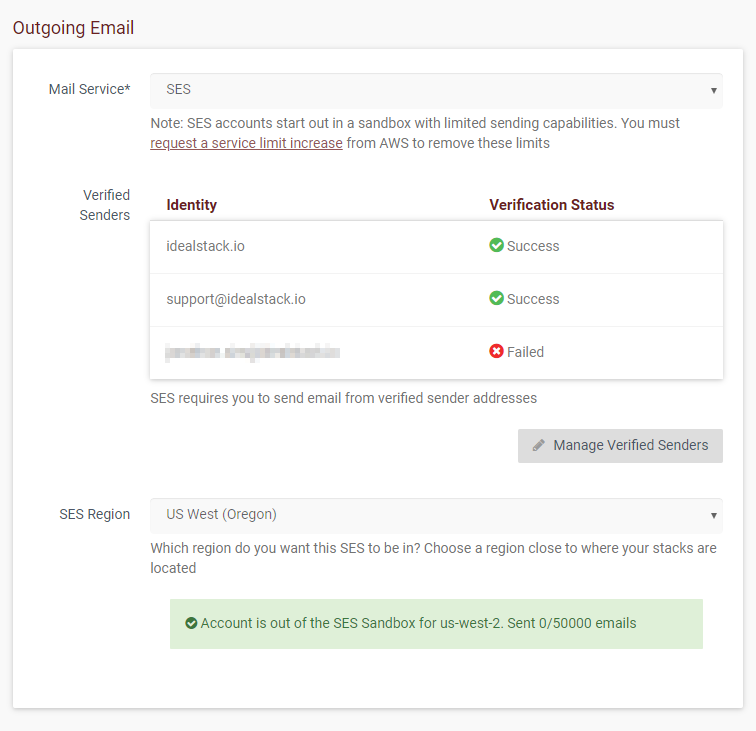
When setting up email in your hosting plan, you can now set an SES region and see the verification and sandbox status directly from idealstack.
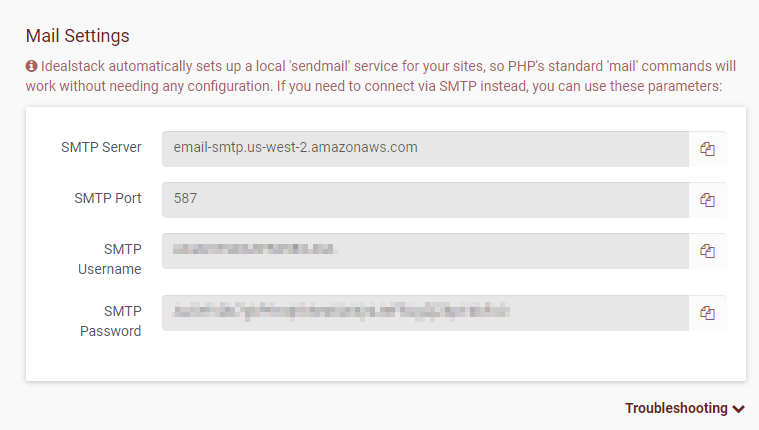
On the site Connect tab you can see the SMTP details for your site
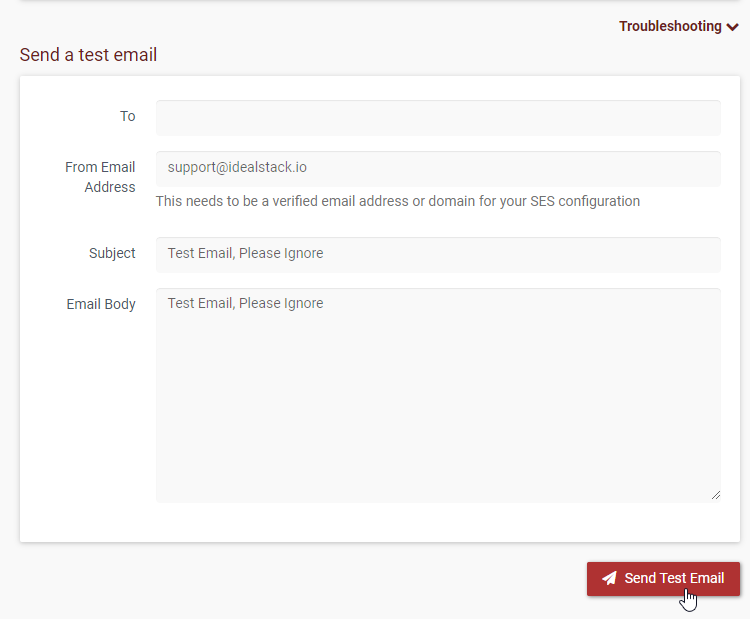
If you fold open the Troubleshooting dropdown now you can also send a test email
Harness the power of AWS for hosting PHP-based websites and apps.
Idealstack is a powerful hosting console that creates a modern, autoscaling,
best-practice, AWS-native hosting cluster for PHP-based code in your AWS account